OBI RED metrics dashboard
Você está visualizando a versão em versão em inglês desta página porque ela ainda não foi traduzida. Possui interesse em ajudar? Veja como contribuir.
OBI RED metrics dashboard
You can import the OBI Dashboard into your Grafana instance. There is a public dashboard with some basic information.
Import dashboard
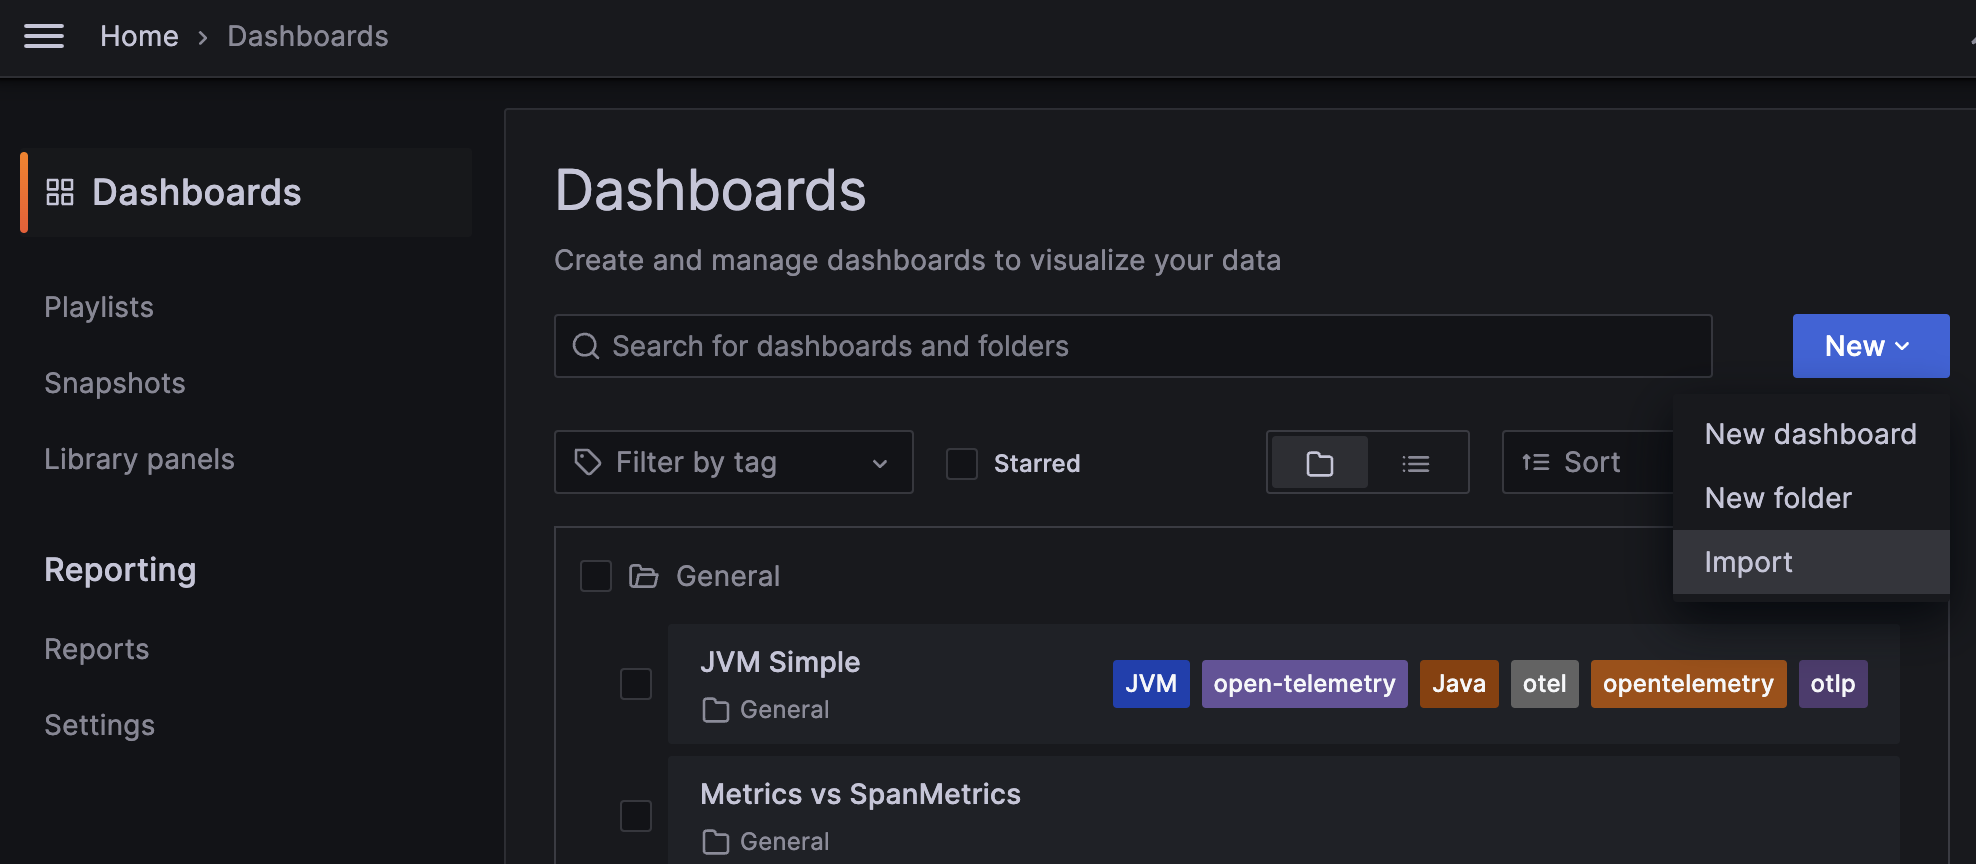
Import the dashboard to your Grafana instance by navigating to Dashboards >
New > Import and provide the dashboard ID 19923:
The example dashboard used as base for this tutorial is the
OBI RED Metrics (ID 19923)
public dashboard.
Use dashboard
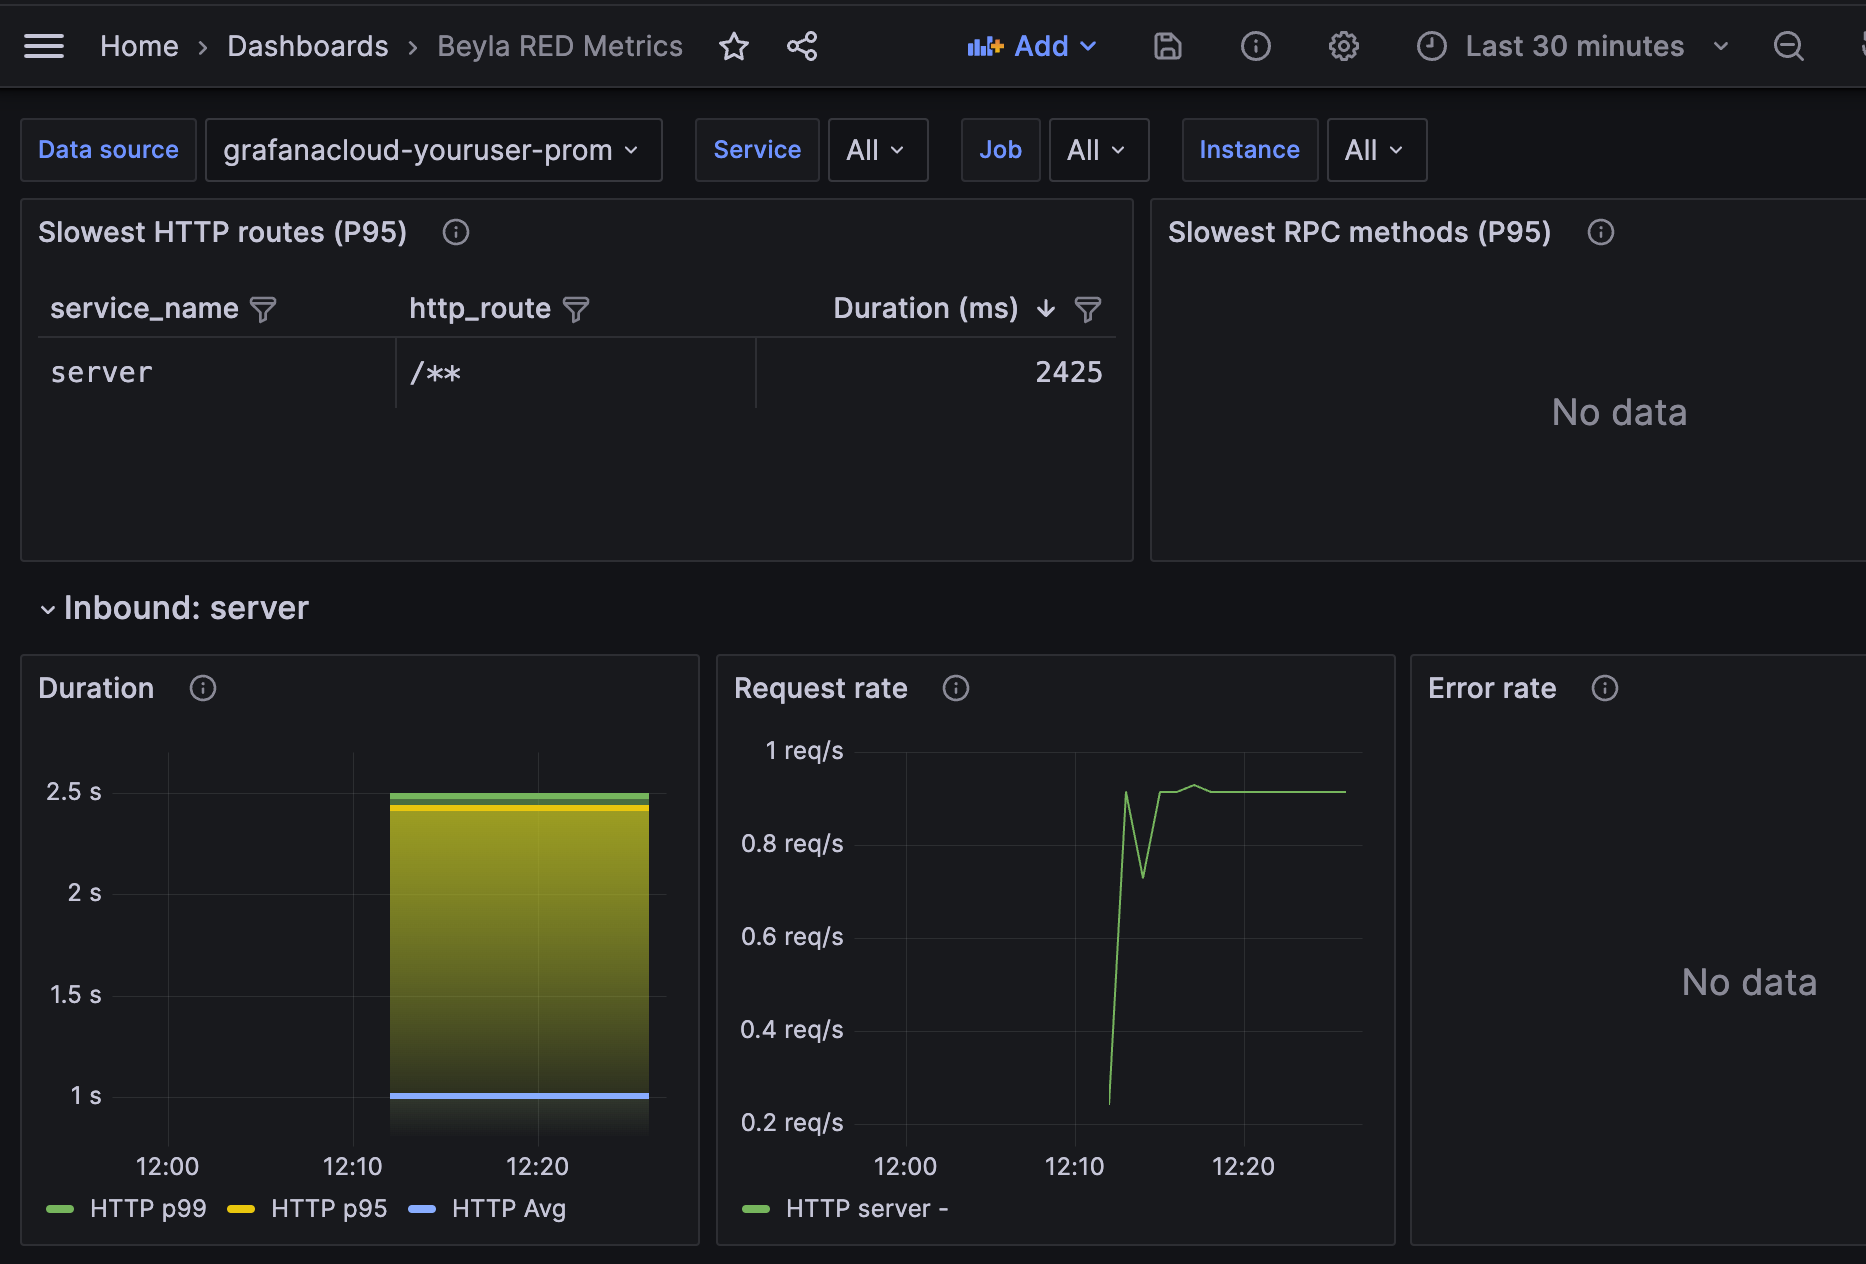
The dashboard displays metrics for each instrumented service. If you only have a single service, only one entry appears. If you configure OBI to instrument multiple services, you’ll see an entry for each service.
Feedback
Was this page helpful?
Thank you. Your feedback is appreciated!
Please let us know how we can improve this page. Your feedback is appreciated!