OBI network metrics quickstart
Você está visualizando a versão em versão em inglês desta página porque ela ainda não foi traduzida. Possui interesse em ajudar? Veja como contribuir.
OBI network metrics quickstart
OBI can generate network metrics in any environment (physical host, virtual host, or container). It’s recommended to use a Kubernetes environment, as OBI is able to decorate each metric with the metadata of the source and destination Kubernetes entities.
The instructions in this quickstart guide focus on deploying directly to Kubernetes with the kubectl command line utility. This tutorial describes how to deploy OBI in Kubernetes from scratch. To use Helm, consult the Deploy OBI in Kubernetes with Helm documentation.
Configuration options
Deploy OBI with network metrics
To enable network metrics, set the following option in your OBI configuration:
Environment variables:
export OBI_NETWORK_METRICS=true
Network metrics requires metrics to be decorated with Kubernetes metadata. To enable this feature, set the following option in your OBI configuration:
Environment variables:
export OBI_KUBE_METADATA_ENABLE=true
For more configuration options, refer to the OBI configuration options.
To learn more about OBI configuration, consult the OBI configuration documentation.
Simple setup
Deploy OBI
The following YAML configuration provides a simple OBI deployment for network metrics:
apiVersion: v1
kind: ServiceAccount
metadata:
  namespace: obi
  name: obi
---
apiVersion: v1
kind: ConfigMap
metadata:
  namespace: obi
  name: obi-config
data:
  obi-config.yml: |
    network:
      enable: true
    attributes:
      kubernetes:
        enable: true
---
apiVersion: apps/v1
kind: DaemonSet
metadata:
  namespace: obi
  name: obi
spec:
  selector:
    matchLabels:
      instrumentation: obi
  template:
    metadata:
      labels:
        instrumentation: obi
    spec:
      serviceAccountName: obi
      hostNetwork: true
      dnsPolicy: ClusterFirstWithHostNet
      containers:
        - name: obi-config
          configMap:
            name: obi-config
        - name: obi
          image: grafana/beyla:main
          securityContext:
            privileged: true
          volumeMounts:
            - mountPath: /config
              name: obi-config
          env:
            - name: OBI_CONFIG_PATH
              value: '/config/obi-config.yml'
Some observations about this configuration:
- The container image uses the latest under-development
grafana/beyla:mainimage. - OBI needs to run as a DaemonSet, as it is requires only one OBI instance per node
- To listen to network packets on the host, OBI requires the
hostNetwork: truepermission
Verify network metrics generation
If everything works as expected, your OBI instances should be capturing and processing network flows. To test this, check the logs for the OBI DaemonSet to see some debug information being printed:
kubectl logs daemonset/obi -n obi | head
The output would be something like:
network_flow: obi.ip=172.18.0.2 iface= direction=255 src.address=10.244.0.4 dst.address=10.96.0.1
Export metrics to OpenTelemetry endpoint
After you have confirmed that network metrics are being collected, configure OBI to export the metrics in OpenTelemetry format to a collector endpoint.
Check the data export documentation to configure the OpenTelemetry exporter.
Advanced setup
OBI works with any OpenTelemetry endpoint. This quickstart uses the OpenTelemetry endpoint in Grafana Cloud. You can get a Free Grafana Cloud Account at Grafana’s website.
From your Grafana Cloud portal, look for the “OpenTelemetry” option in the left side panel, under the “Connections” section.
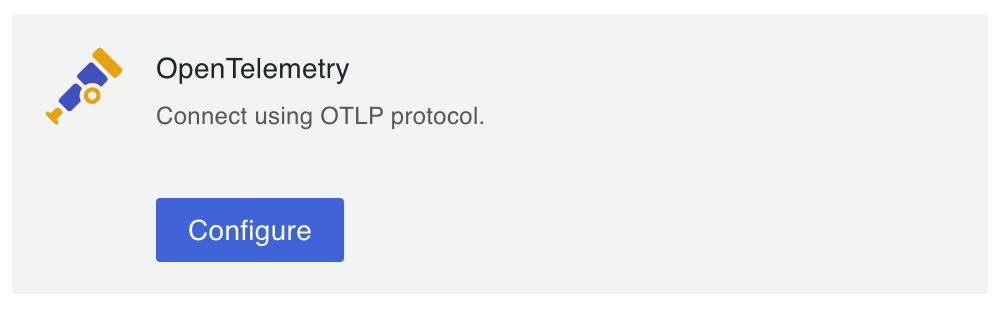
In the OpenTelemetry page, you can consult the connection information that you need to pass as endpoint and credentials information for OBI.
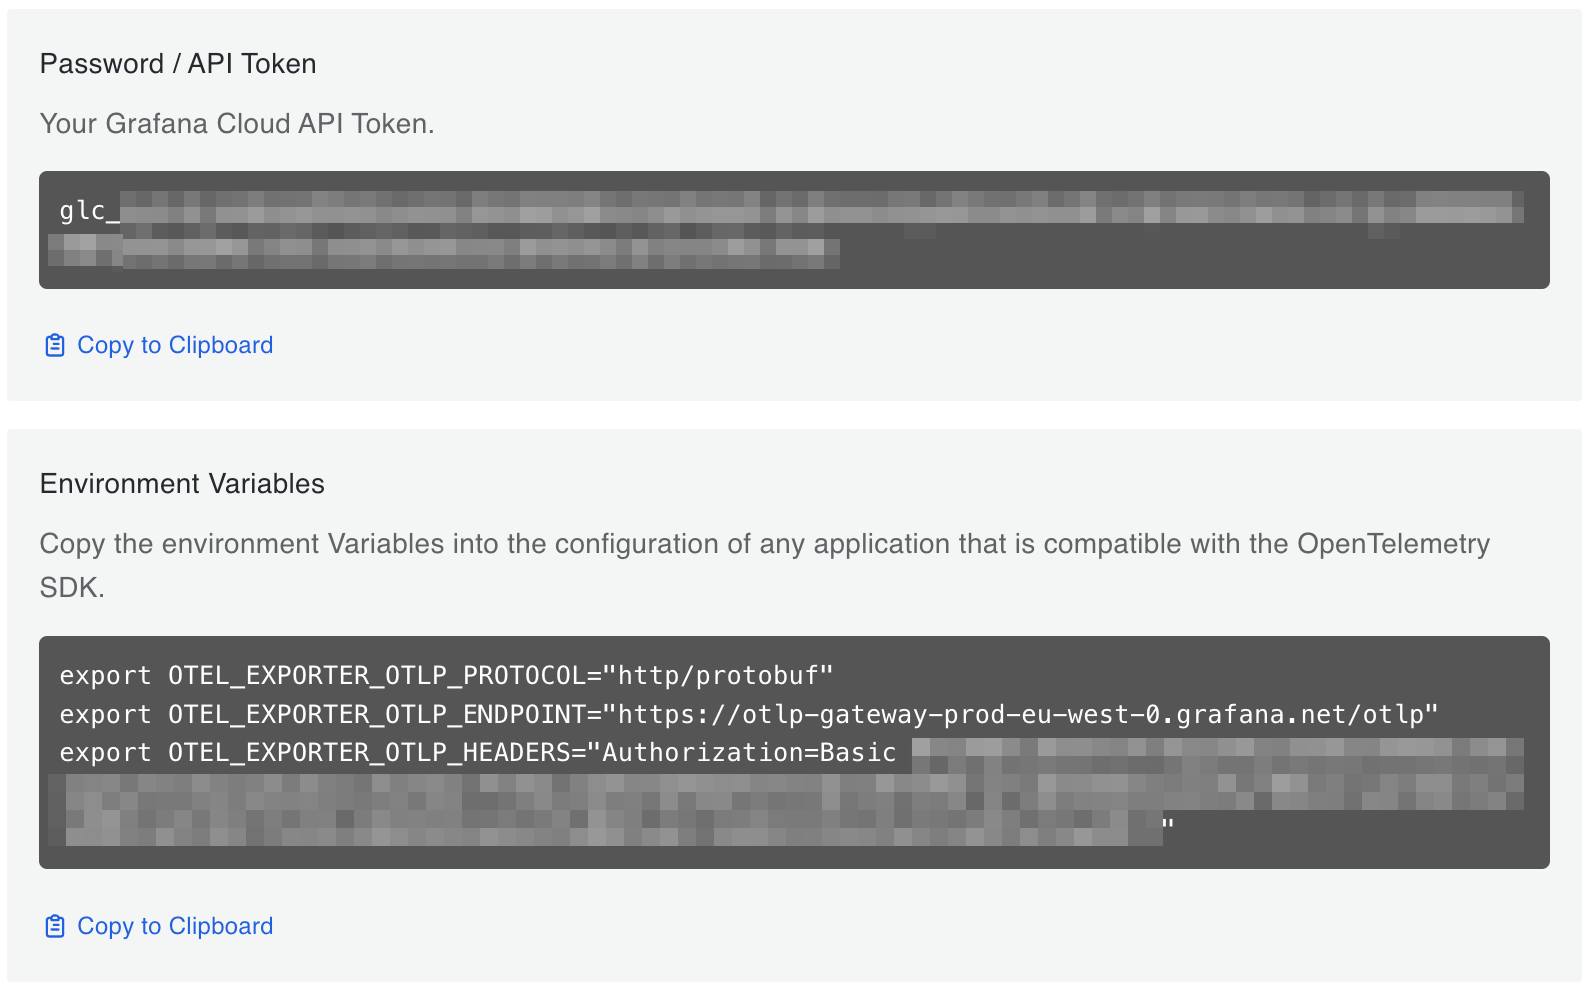
To send metrics to Grafana Cloud, you must provide the
OTEL_EXPORTER_OTLP_ENDPOINT and OTEL_EXPORTER_OTLP_HEADERS environment
variables to your OBI process.
More details about them in the configuration options reference.
Also Add OTEL_EXPORTER_OTLP_ENDPOINT and its value as an environment variable
to the OBI container in the Kubernetes manifest. The env section of the obi
container in the manifest from the start of this document should look like:
env:
  - name: OBI_CONFIG_PATH
    value: '/config/obi-config.yml'
  - name: OTEL_EXPORTER_OTLP_ENDPOINT
    value: 'https://otlp-gateway-prod-us-central-0.grafana.net/otlp'
  - name: OTEL_EXPORTER_OTLP_HEADERS
    value: 'Authorization=Basic <your-cloud-credentials>'
Allowed attributes
Be default, OBI includes the following attributes in the
obi.network.flow.bytes metric:
k8s.src.owner.namek8s.src.namespacek8s.dst.owner.namek8s.dst.namespacek8s.cluster.name
OBI only includes a subset of the available attributes to avoid leading to a cardinality explosion.
For example:
network:
  allowed_attributes:
    - k8s.src.owner.name
    - k8s.src.owner.type
    - k8s.dst.owner.name
    - k8s.dst.owner.type
The equivalent Prometheus metric would be:
obi.network.flow.bytes:
  k8s_src_owner_name="frontend"
  k8s_src_owner_type="deployment"
  k8s_dst_owner_name="backend"
  k8s_dst_owner_type="deployment"
The previous example would aggregate the obi.network.flow.bytes value by
source and destination Kubernetes owner name and type, instead of individual pod
names.
CIDR configuration
You can configure OBI to also break down metrics by CIDR ranges. This is useful for tracking traffic to specific network ranges, such as cloud provider IP ranges, or internal/external traffic.
The cidrs YAML subsection in network (or the OBI_NETWORK_CIDRS environment
variable) accepts a list of CIDR ranges, and the corresponding name.
For example, to track metrics by predefined networks:
network:
  cidrs:
    - cidr: 10.0.0.0/8
      name: 'cluster-internal'
    - cidr: 192.168.0.0/16
      name: 'private'
    - cidr: 172.16.0.0/12
      name: 'container-internal'
Then, the equivalent Prometheus metric would be:
obi_network_flow_bytes:
  src_cidr="cluster-internal"
  dst_cidr="private"
Feedback
Was this page helpful?
Thank you. Your feedback is appreciated!
Please let us know how we can improve this page. Your feedback is appreciated!